
The MagnusBilling dashboard records the highest Concurrent Calls (CC) and Calls Per Second (CPS) observed during the day. These two peaks describe different kinds of load and should be evaluated separately.
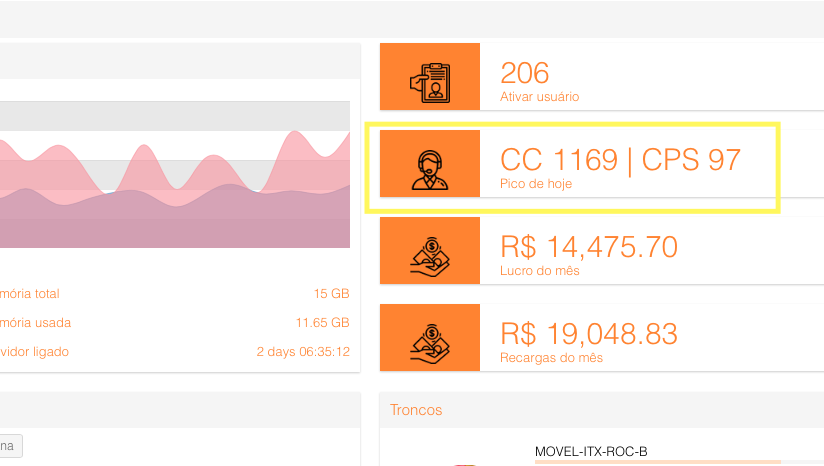
What CC and CPS mean
- CC measures connected calls active at the same time. It reflects sustained channel, media and billing load.
- CPS measures new call attempts started in one second. It reflects short bursts of signaling, routing and database work.
How to interpret the daily peaks
- Peak CC answers: what was the largest number of simultaneous connected calls?
- Peak CPS answers: what was the largest one-second burst of call attempts?
- The two peaks do not need to occur at the same time.
- A high CPS burst can exist with low CC when few calls answer or calls are short.
- High CC can exist with modest CPS when answered calls remain connected for a long time.
Use the counters for capacity planning
Compare the dashboard peaks with CPU, memory, database latency, SIP response times, call quality and failure logs from the same period. A peak is evidence of observed traffic, not a universal capacity limit or a guarantee that every traffic profile will behave the same way.